
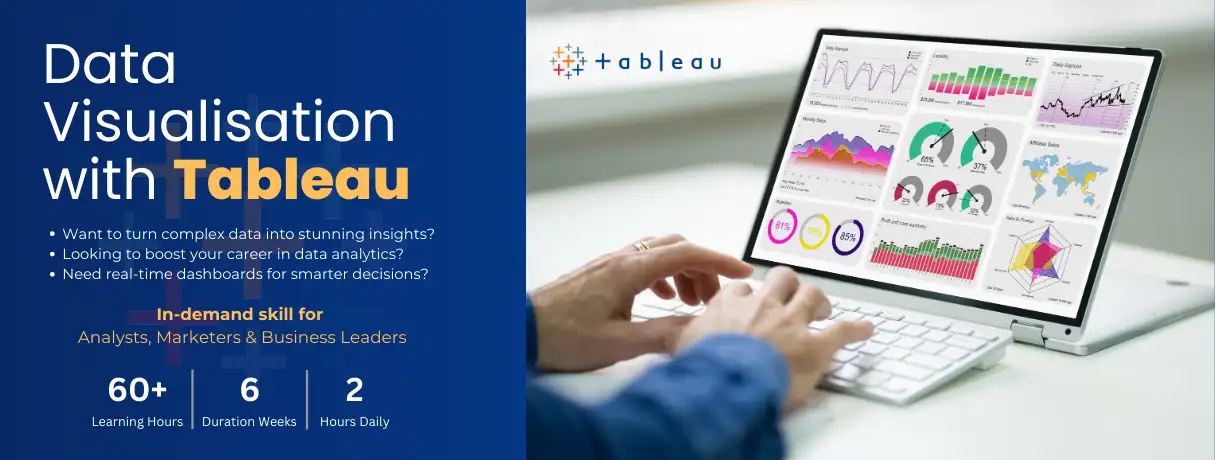
Data Visualisation with Tableau
Course Description:
Data Visualization with Tableau is a 6-week course that teaches you how to turn complex, messy data into clear, interactive visual insights. You will learn how to connect data from sources like Excel and databases, clean it up, and build professional dashboards. The course focuses on making data easy to understand so businesses can make smart decisions. It is perfect for students, professionals, and job seekers aiming to enter the exciting world of data analytics and business intelligence.
Course Contents:
• TABLEAU FUNDAMENTALS • Introduction to business intelligence, the Tableau interface, and connecting to data sources (Excel, CSV, databases)
• DATA PREPARATION • Clean data, manage dimensions and measures, and apply filters, sorting, and grouping
• VISUALIZATION & CHARTS • Create diverse charts (bar, line, pie, maps, scatter) and use calculated fields
• ADVANCED FEATURES • Work with parameters, interactive controls, data blending, and database joins
• DASHBOARDS & REPORTING • Build interactive dashboards, create data stories, and publish real-world business reports
Course Outcome:
By the end of this course, you will be able to transform raw data into meaningful, interactive dashboards and reports using Tableau. You will gain practical skills in data analysis, visualization, and storytelling. This prepares you for high-paying roles such as Data Analyst, MIS Executive, and Business Intelligence Associate, ensuring you can make confident, data-driven decisions.